Fund Reality
Indian mutual funds, explained with 13 years of real data
Agent commissions quietly come out of mutual fund returns every year.
A Python data pipeline over 13 years of daily NAVs and a scroll-driven explainer site.
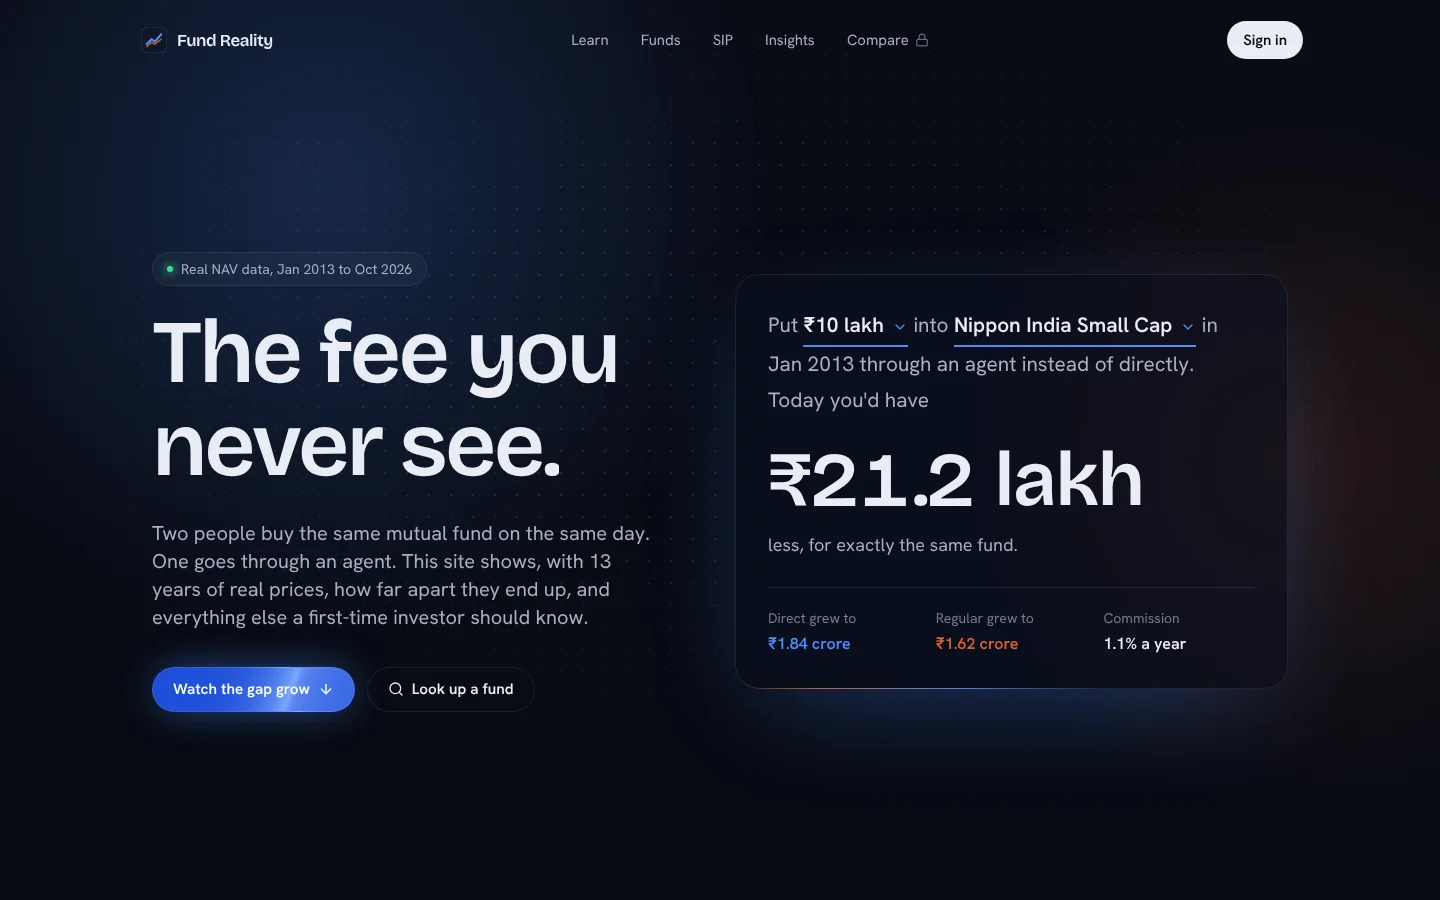
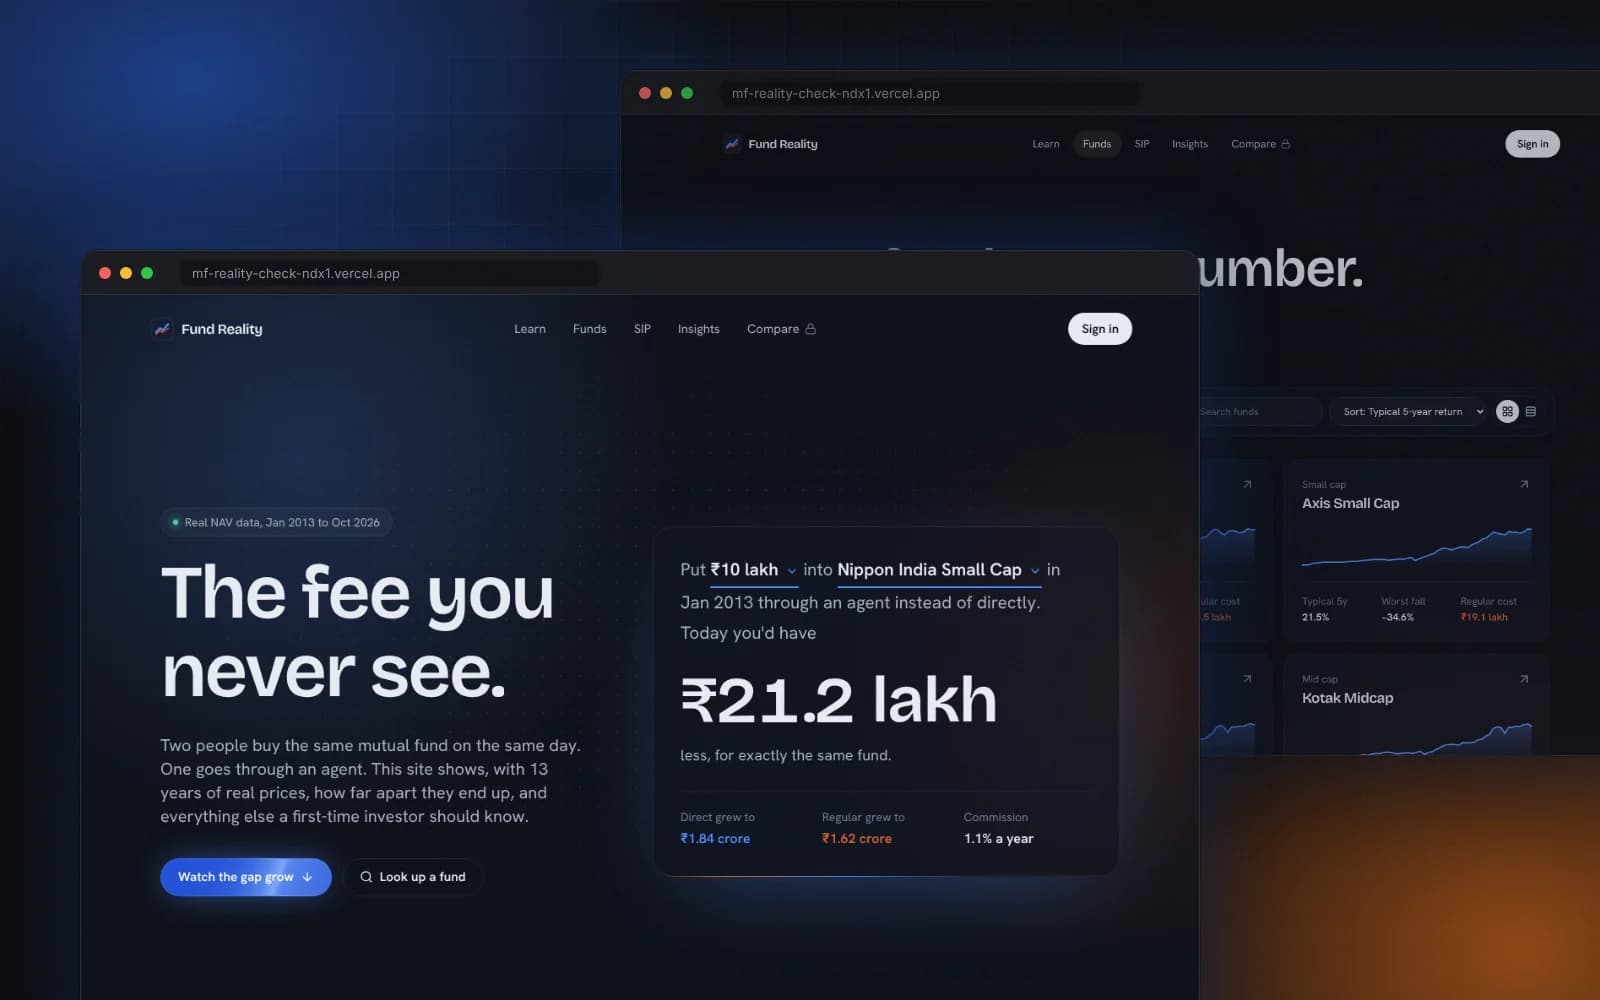
Shows ₹10 lakh through an agent ended ₹9.9 lakh smaller on average.
- Role
- Design, data pipeline and front-end
- Year
- 2026
- Stack
- Next.js, TypeScript, Python, pandas, ECharts, Framer Motion, Supabase
Overview
A data-storytelling site that shows first-time investors what the Regular plan of a mutual fund really costs, what a typical investor actually earned, and how far funds can fall.
The problem
Most Indians buy mutual funds through an agent without knowing the commission is taken from their returns every year. Fund factsheets show one cherry-picked return figure, so the real cost and the real risk stay invisible.
What I built
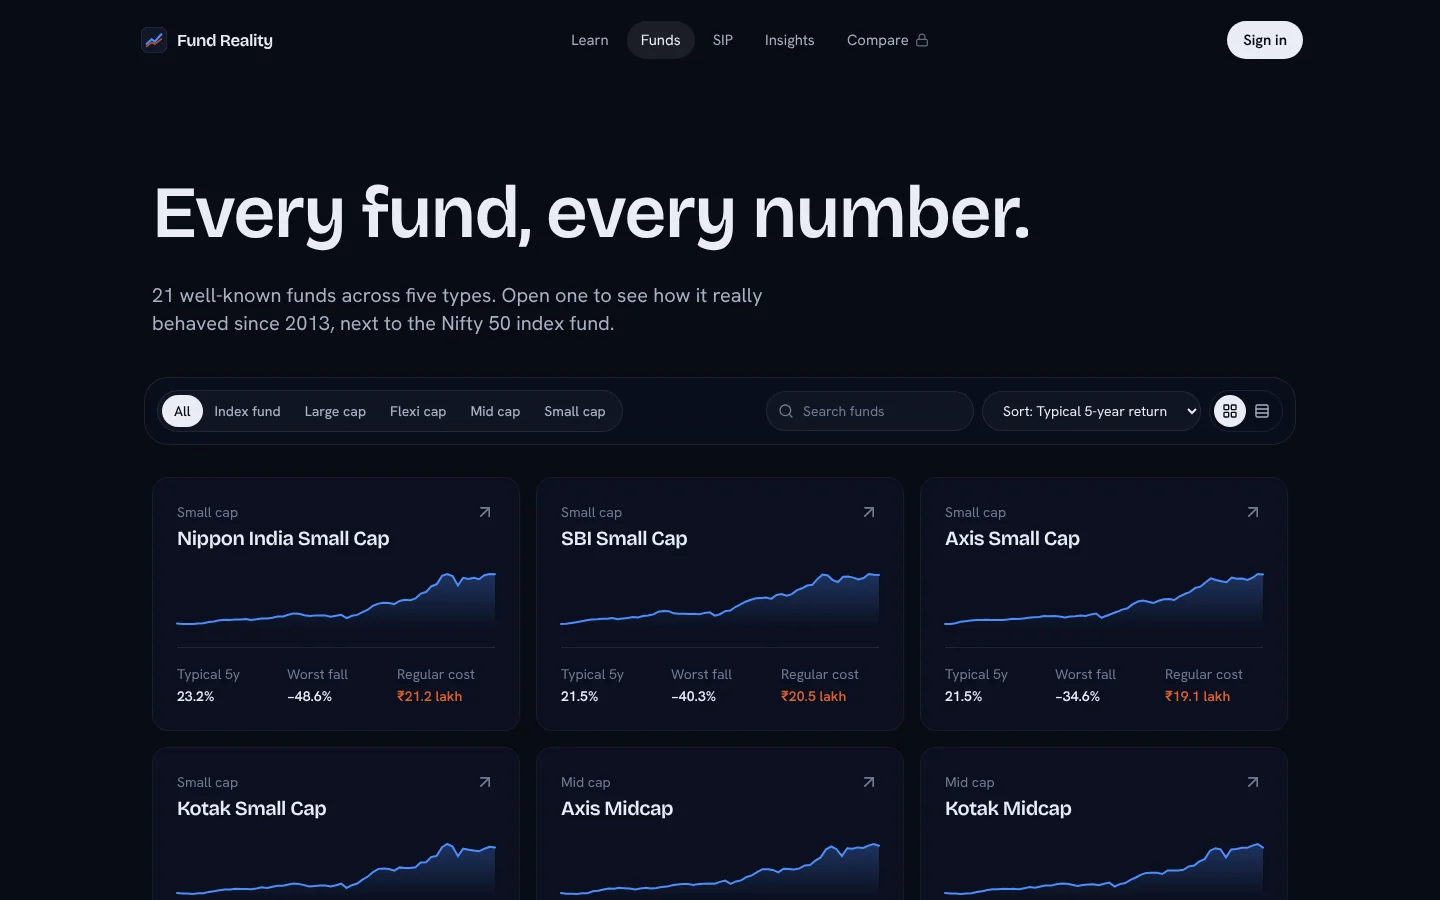
- 1Downloaded daily NAV history for 21 well-known funds, both Direct and Regular plans, from January 2013 to October 2026, and cleaned it with Python and pandas.
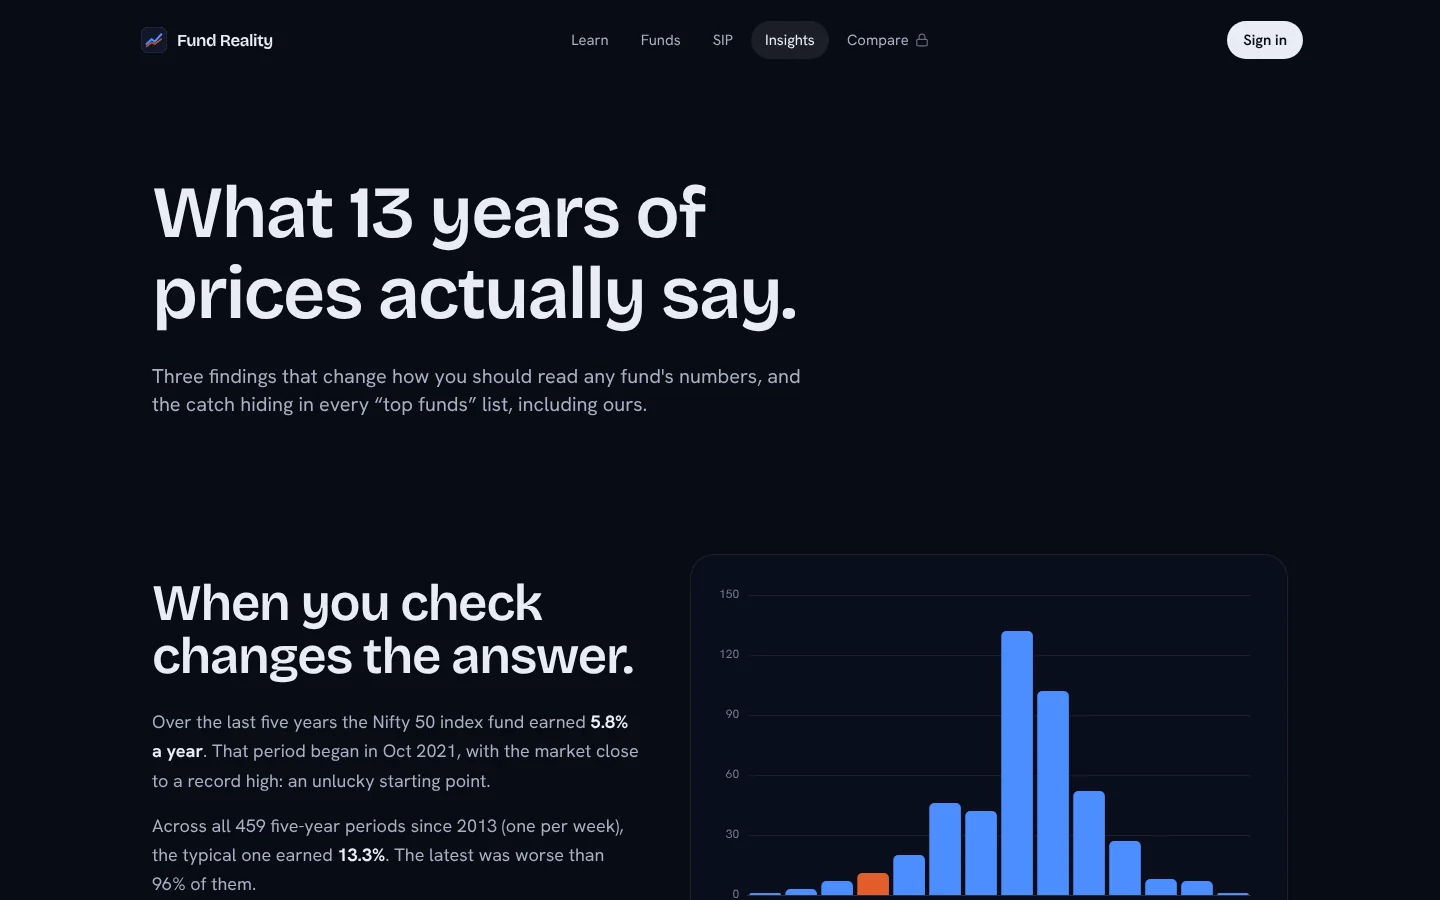
- 2Computed rolling 5-year returns over every possible start date, worst drawdowns, and the rupee gap between Direct and Regular plans.
- 3Designed a scroll-driven home page where the Direct and Regular lines draw themselves and the gap grows, plus a calculator answering one question: what did the agent cost you?
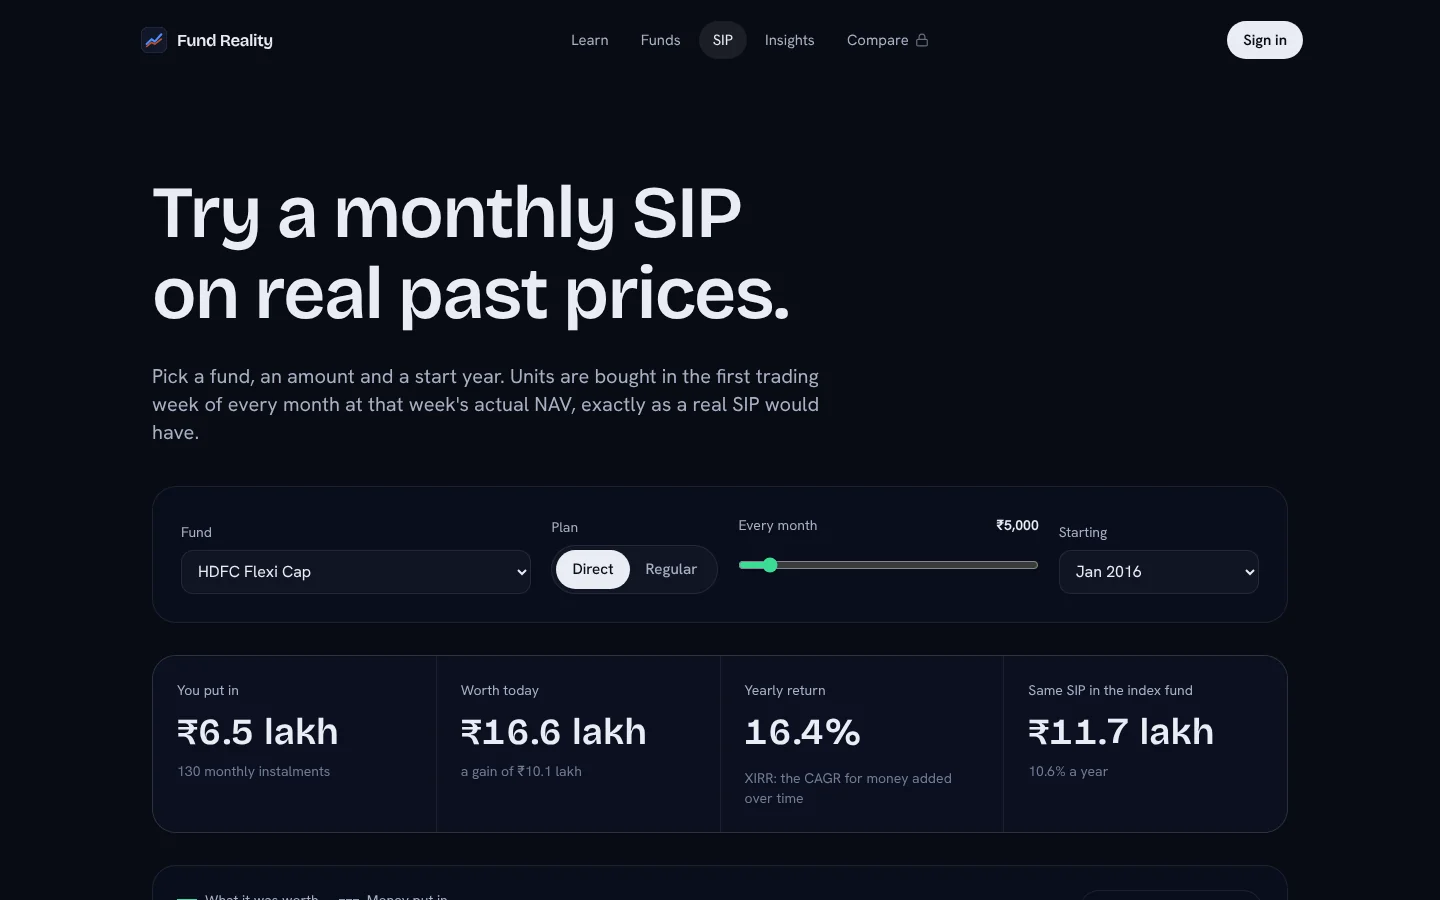
- 4Added a SIP simulator that replays monthly investing on real historical prices and reports XIRR against an index fund.
- 5Built member features on Supabase with row-level security: a portfolio cost check, watchlist, saved SIP plans and a 3-fund compare.
Highlights
- ₹10 lakh invested through an agent in 2013 ended ₹9.9 lakh smaller on average, and ₹21.2 lakh smaller in one small-cap fund.
- Explains selection and survivorship bias openly, including in its own fund list.
- Every chart is drawn from real data, not illustrations.
How it works
- mfapi.in (AMFI NAVs)
- Python + pandas cleaning
- Rolling returns, drawdowns, XIRR
- Static JSON in public/data
- Next.js + ECharts UI
- Supabase auth (members)
Key decisions and trade-offs
Precompute everything offline
The analysis runs once in Python and ships as static JSON, so public pages load fast and need no database.
Every 5-year window, not one return
A single 5-year return depends on its start date. Showing all 459 windows shows the range investors actually got.
State the bias openly
The fund list is well-known survivors, so the site explains selection and survivorship bias and compares with S&P's SPIVA scorecard.
What I'd improve next
- Add closed and merged funds to remove survivorship bias.
- Include taxes and exit loads, which returns currently ignore.
- Compare mid and small caps with their own indices, not only the Nifty 50.
Live demo
Screens